If you're googling VSCode development environment Zig, this post should help.
The first step is downloading & installing Zig.
Installing Zig
I personally suggest using Zig from the master on git, but Zig also has versioned releases.
With Homebrew (macOS):
brew install zig --HEAD
With Snap (Ubuntu):
snap install zig --classic --edge
You can read more about installing or download binaries separately
Zig Language Server (zls)
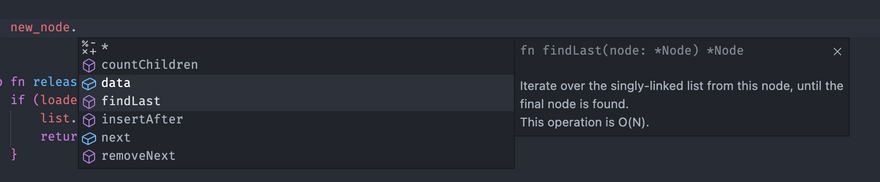
zls is the language server for Zig. It gives your editor autocomplete, better errors, and semantic highlighting.
It enables completions for functions & types.
To install zls, I suggest compiling it from source. Zig's compiler is fast, so it shouldn't take long.
git clone https://github.com/zigtools/zls
cd zls
git submodule update --init --recursive --progress
zig build -Drelease-fast
Configuring zls
From your zls directory, run this:
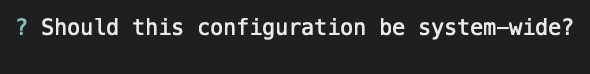
./zig-out/bin/zls configure
If you're asked this, press n or it will fail unless you run as sudo
Configuring Visual Studio Code
There are two extensions you will want to install.
-
vscode-ziggives you syntax highlighting and is required forzig fmtto run automatically on save. -
zls-vscodesets up zls
Configuring vscode-zig
To auto format on save, set tiehuis.zig to the default formatter in your VSCode settings.json.
  "[zig]": {
    "editor.defaultFormatter": "tiehuis.zig"
  },
This is powered by zig fmt. If you're familiar with JavaScript, zig fmt is like prettier (or like go fmt)
You can also enable build on save for higher quality error messages. For most projects, Zig's compiler is fast enough for that to work well.
"zig.buildOnSave": true,


Top comments (17)
Just noticed: the amazing
zlsnow supports both formatting and syntax hi-lighting!Just started this journey.
In a VSCode setup, besides having "ZLS for VSCode" extension installed, is there any option to have also formatting and syntax hightlighting, please?
Thanks.
@dxps
I should add, don't forget to do
zls configand go through the setup options.Yeah, found it and just did that.
Reloaded and restarted VSCode. Now, there seems to be some syntax highlighting (just on brackets), but no formatting on save.
@dxps If you run the Format Document command in VSCode it should run
zig fmtbehind the scenes. Then you can toggle on the general VSCode preference: Editor: Format On Save.Just found out that in the ZLS output ("output" vscode pane), whenever I do save it throws a "need to run as root or suid".
Gotta go to sleep, it's late here, i'll solve it tomorrow.
Thanks again for the help! Really appreciate it!
Oh wow: i have never seen that error. Cheers I'm sure you'll get it sorted.
Issue solved.
I had to do
chmod a+x {path/to}/zls(instead of just
chmod +x ...).@dxps
zlsactually does all that already for VSCode! github.com/zigtools/zls#featuresApparently it doesn't in my case.
And the only setting that I have it the (full) path to
zls, as required.Thanks for the quick feedback, Alex!
I'll see if I can find the root cause of it.
@dxps ah gotcha. Maybe try going through the
zls configsetup. Also it may be necessary match your zls with your zig version. For example I am running zig 0.9.1 and zls 0.9.0.Very nice post! I would love to know more about setting up VSCode for debuging Zig with gdb/lldb.
You can use Microsoft's C++ extension for debugging. When you hit F5 (Launch) in VS Code a wizard should pop up to guide you in creating a launch.json file for your project. Here's an old post of mine on how to do that on Windows: dev.to/fabioarnold/setup-zig-for-g...
One more exception: macOS arm64 isn't yet supported by Microsoft's debugging extension. I found CodeLLDB to be a good replacement.
I've seen somebody make this work, it required adding a tiny little bit of scripting to vscode (mainly to know where the test executable gets saved) and then it would work very easily, IIRC.
I am using Zig + VSCode on MacOS with this LLDB extension
vadimcn.vscode-lldb.marketplace.visualstudio.com/items...
Some things are a bit unintuitive, like
constvalues are displayed as<no location, value may have been optimized out>, but it basically seems to work.One thing I have not solved though, is how to run the debugger on tests. How does one generate a test executable for debugging? Basically want to be able to launch an executable that is that same as:
zig build testAlso found this article but YMMV, I didn't have any success with that other debugger.
dev.to/watzon/debugging-zig-with-v...
@kristoff @batiati
Figured it out: to run the test executable in a debugger, first run
zig build test, then a test executable will be in the cache dir:An example launch.json using the CodeLLDB extension:
Now try hitting some breakpoints in your tests- it works for me.
Tried this today, but there's nothing in there called test. Have you found a solution that works with 0.11?